Chart Splat
A serverless Chart.js API that converts JSON data into beautiful PNG charts in milliseconds.
Screenshots
Overview
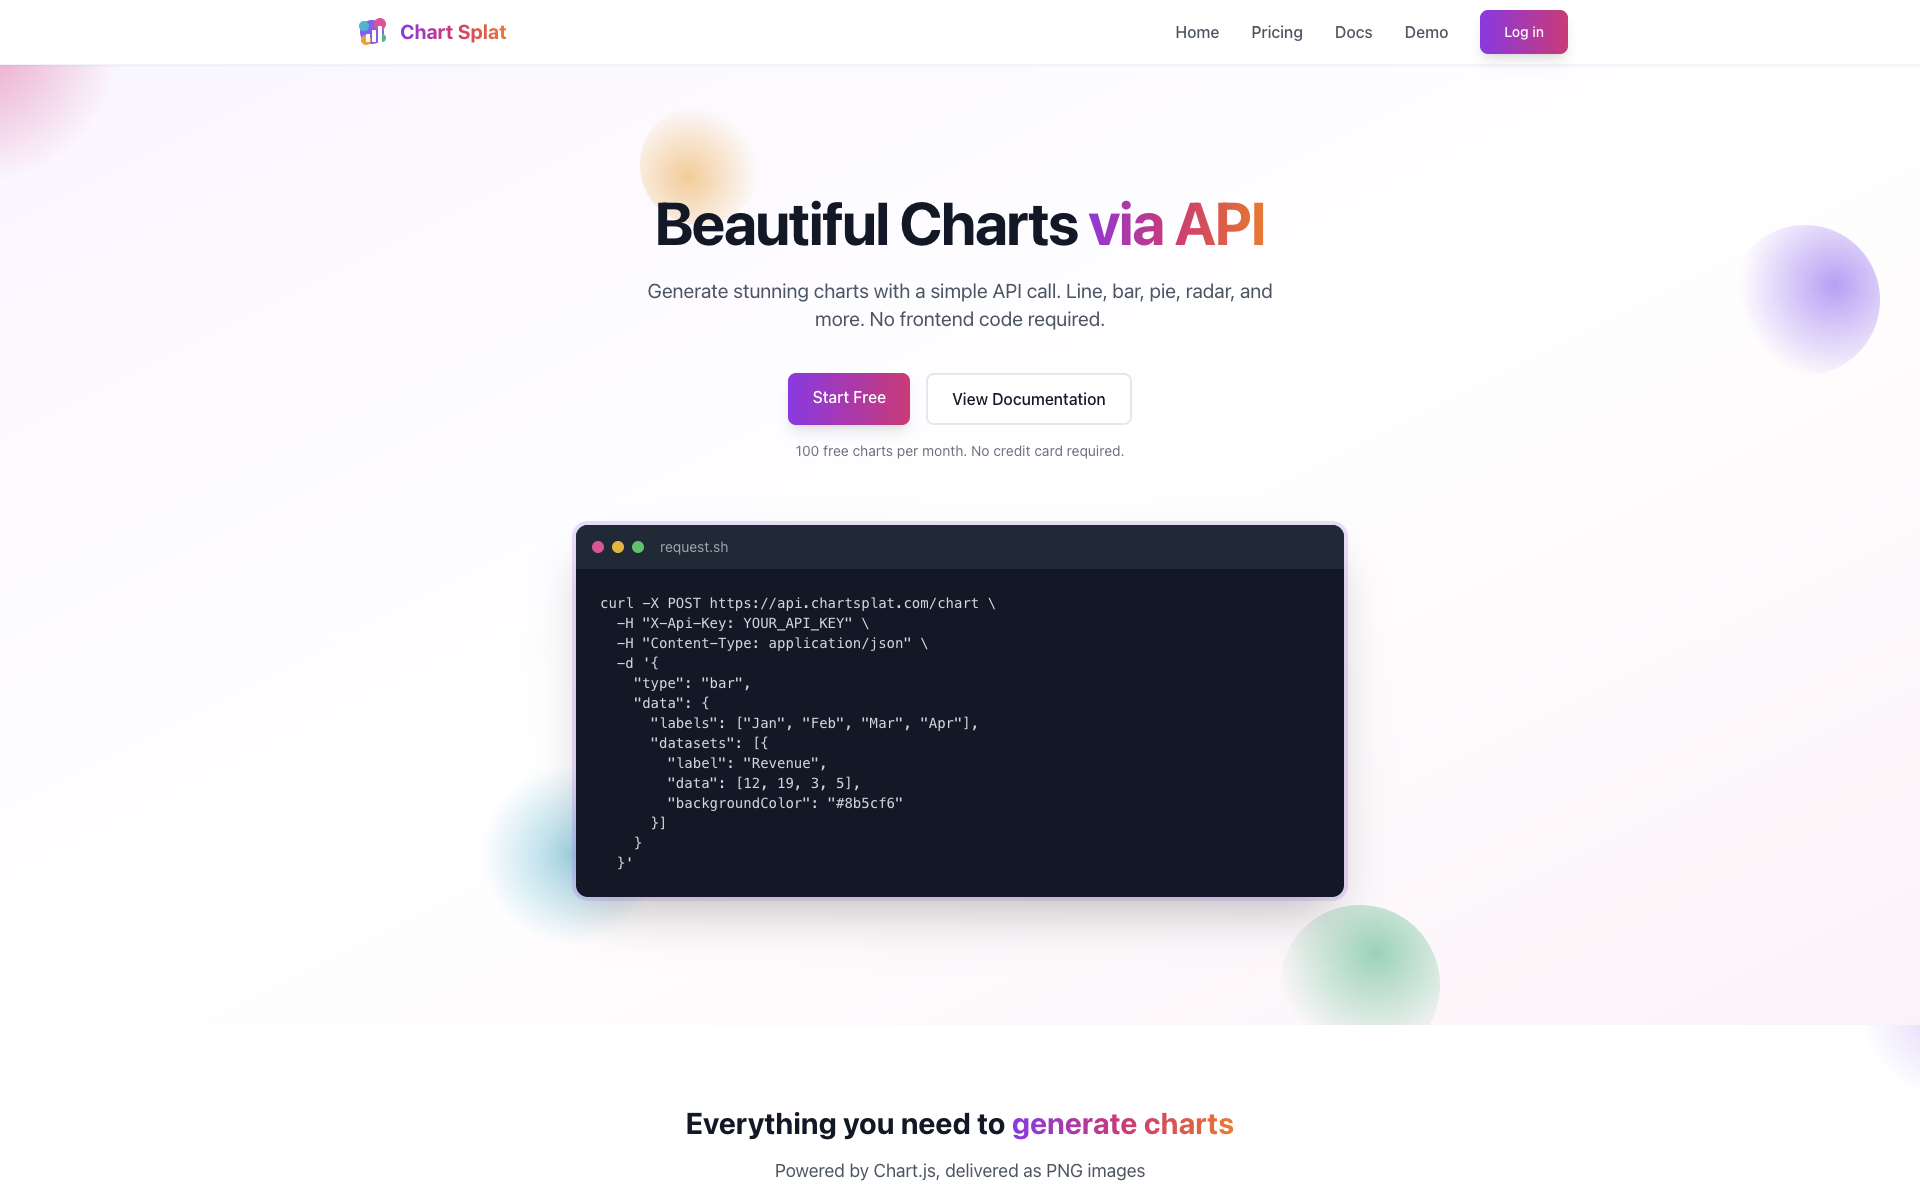
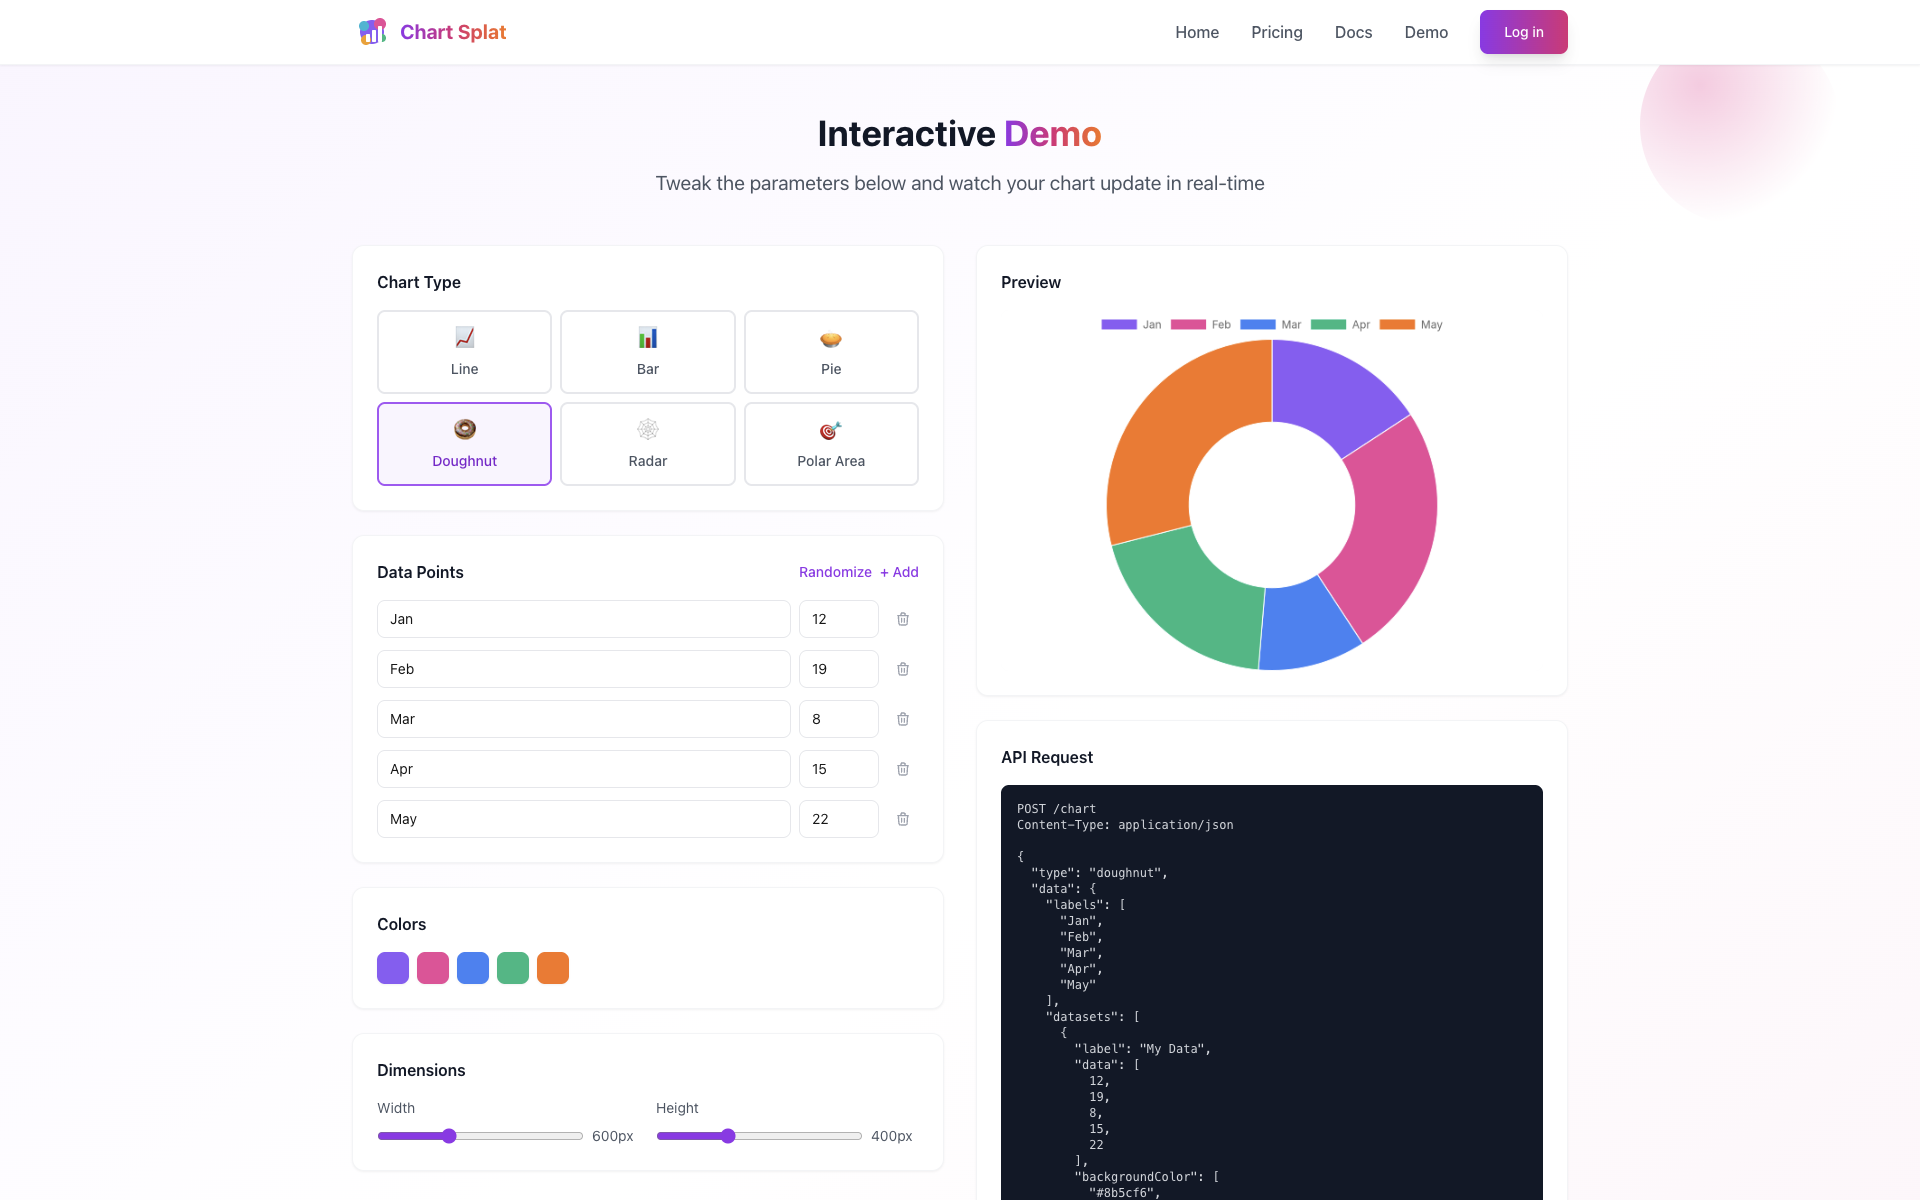
Chart Splat is a chart generation API powered by Chart.js v4 that converts JSON data requests into PNG images. Simply submit an API call with your chart configuration and receive a base64-encoded PNG image ready to use anywhere. The service supports Line, Bar, Pie, Doughnut, Radar, and Polar Area charts with full Chart.js customization options.
The Challenge
Options for server-side chart rendering in PHP are limited. While Node.js has excellent charting libraries like Chart.js, integrating them into PHP applications or other backend systems requires running a separate Node.js service or using complex headless browser solutions.
Developers needed a simple way to generate charts from any backend language without managing Node.js infrastructure or dealing with browser automation complexity.
Our Solution
Chart Splat provides a simple REST API that accepts a JSON blob containing Chart.js configuration and returns a beautiful PNG chart. Charts are generated in milliseconds using serverless infrastructure that scales automatically from 100 to over 1 million charts per month.
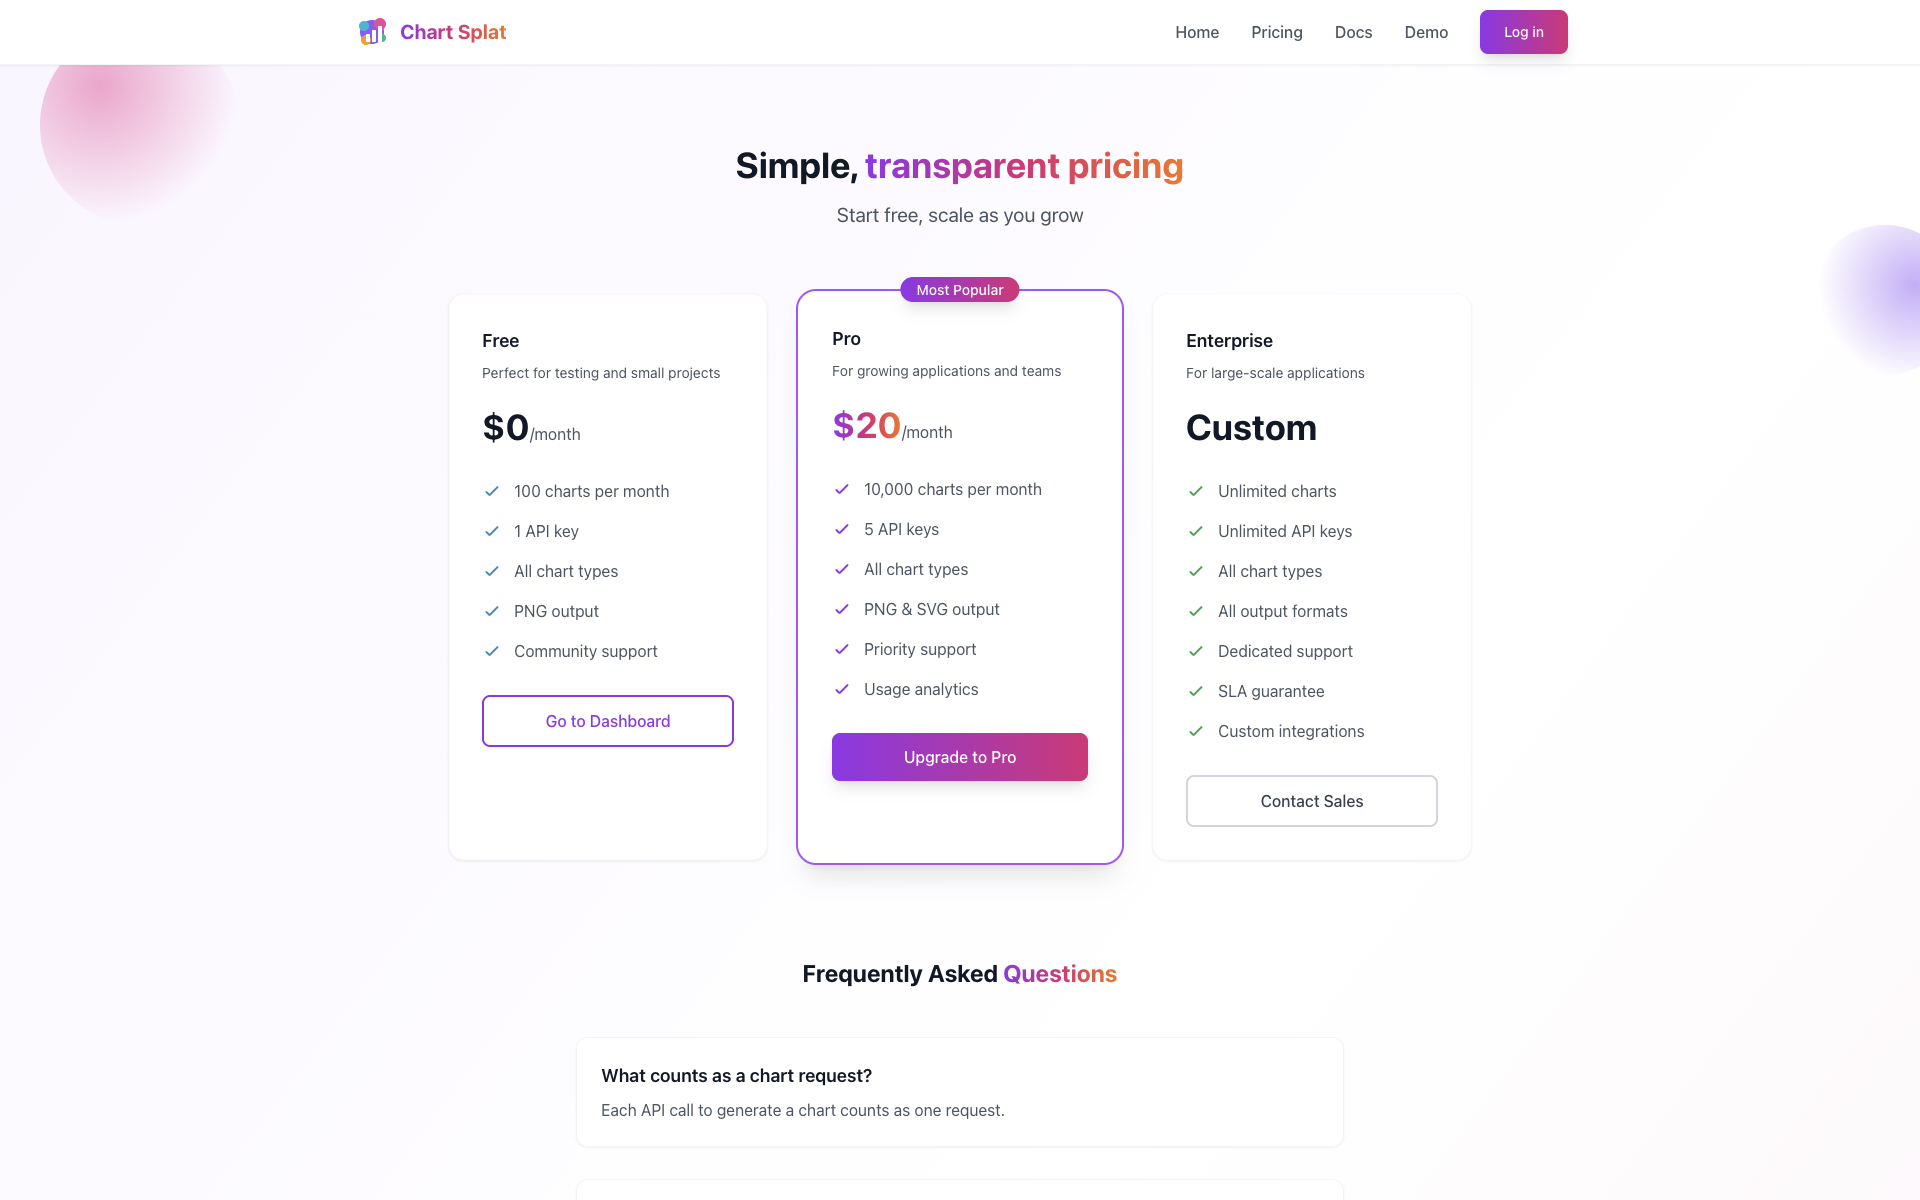
The service offers 99.9% uptime with built-in rate limiting and API key security. Developers can use all Chart.js customization options including colors, fonts, legends, and tooltips. The pay-per-use pricing model includes 100 free charts per month with no credit card required.
The full-stack TypeScript architecture uses Next.js 14 with React 18 on the frontend and AWS SAM-deployed serverless Lambdas on the backend. Authentication is handled by Amazon Cognito, usage tracking via DynamoDB, and billing through Stripe integration.
Frontend Stack
- Next.js 14 / React 18
- TypeScript / Tailwind CSS
- AWS Amplify for auth/UI
Backend Stack
- AWS SAM / Lambda (Node.js 20)
- API Gateway / Cognito
- DynamoDB / Stripe
Chart Types
- Line & Bar Charts
- Pie & Doughnut Charts
- Radar & Polar Area Charts
Key Features
- Millisecond generation time
- Full Chart.js v4 options
- 99.9% uptime SLA
- 100 free charts/month
Need a Serverless API Built?
Let's discuss how we can create scalable, pay-per-use services for your business.